 XFX 7800 GTX and AMD 64 3500+XFX 7800 GTX and AMD 64 3500+
Here is the chart I made with the results for paths 2.0, 2_a and 3.0 (click the image to enlarge):
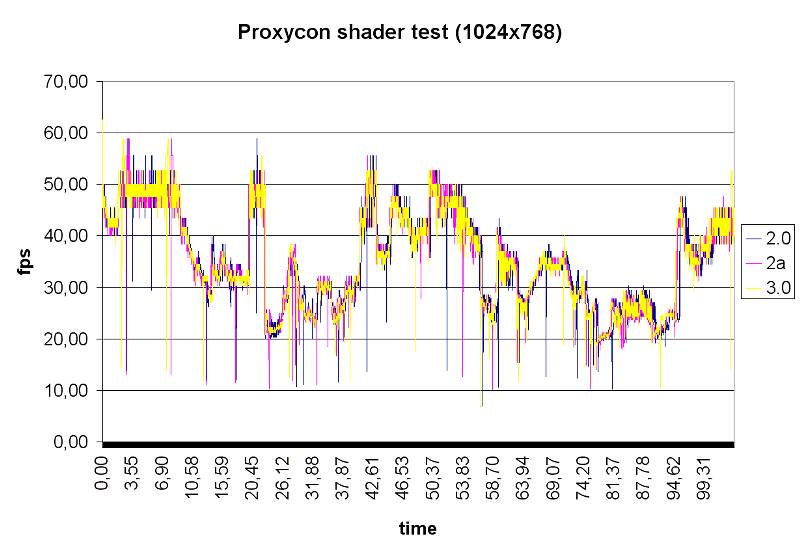
You will observe that the performance of this monster means that almost all paths are performance-equivalent. There is no easy telling them apart.
In this chart, I compare the performance of my two main systems (6800U on an XP 3000+, and 7800GTX on a 64 3500+). For purely sadistic reasons, I've added the scores of the Radeon 9800 on an XP 3000+ :
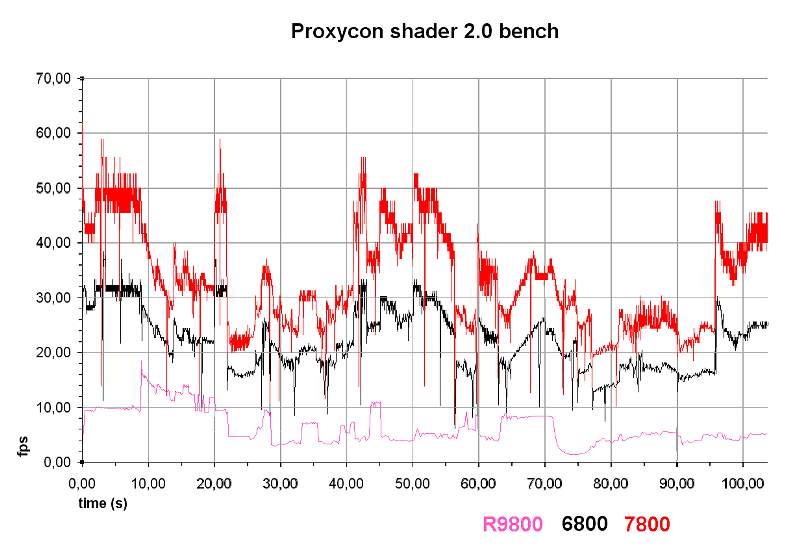
The difference in performance level is painfully obvious here.
In this chart, I assemble the data comparing the 6800 Ultra and the 7800 GTX done at 1280x1024 :
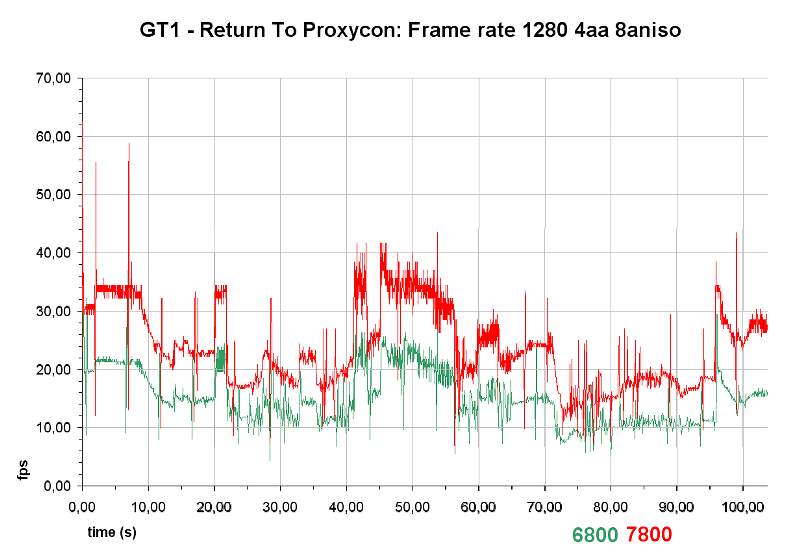
As you can see, the 6800 is consistently outclassed by a clear margin.
Actually, I even tried a comparison of the 6800 at 1280 with the 7800 at 1600 :
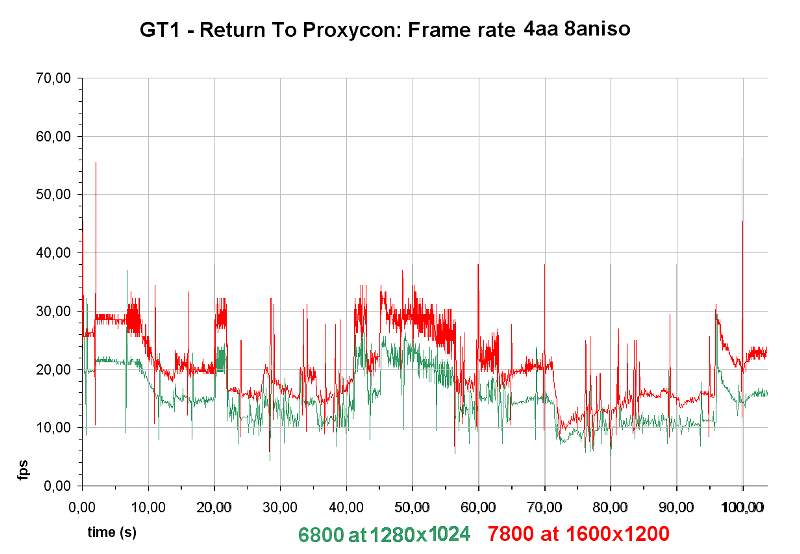
Okay, this is nuts, but still. The 7800 remains above the performance of the 6800, even at the next order of resolution.
Now that is what I call performance !
Unfortunately, it is unplayable at less than 30fps average.